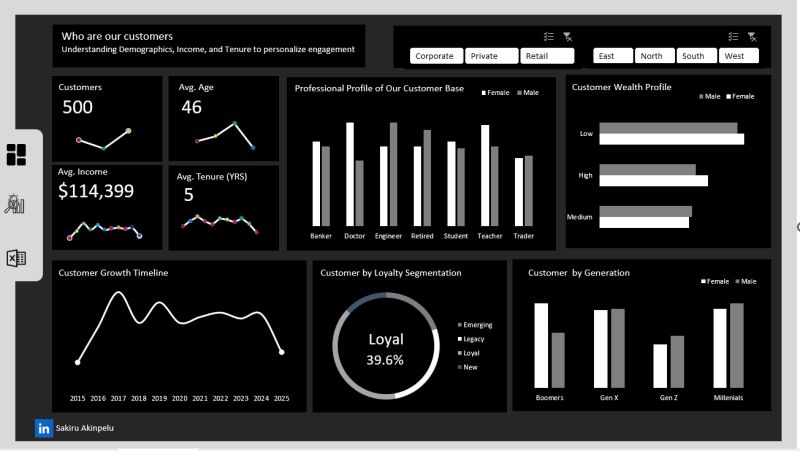
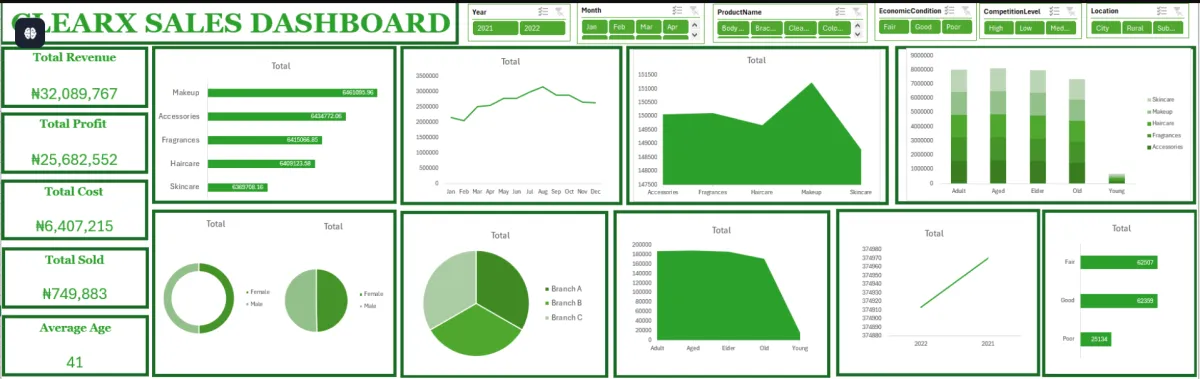
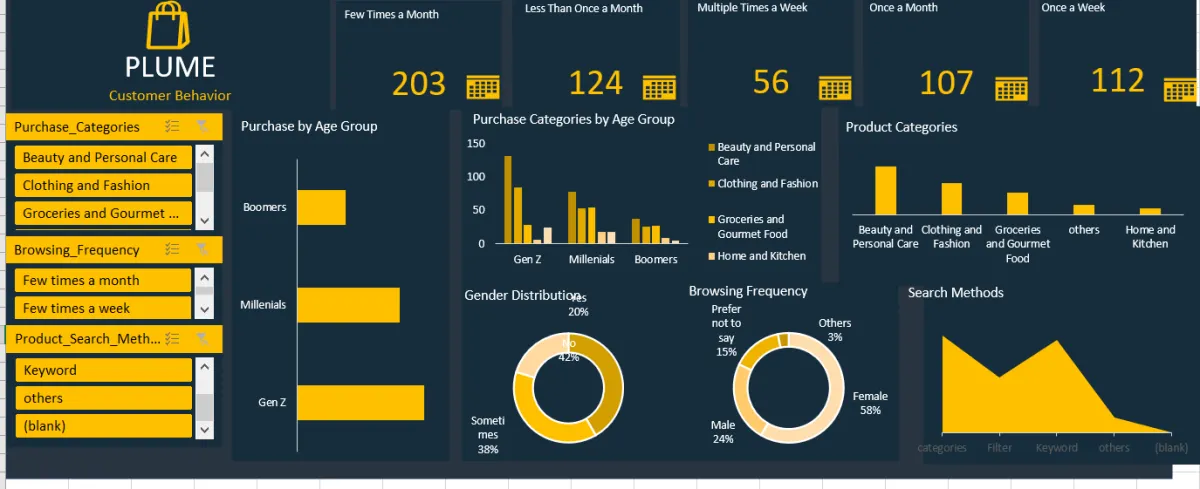
Customer Insight
Customer behaviour analysis dashboard built in Excel.
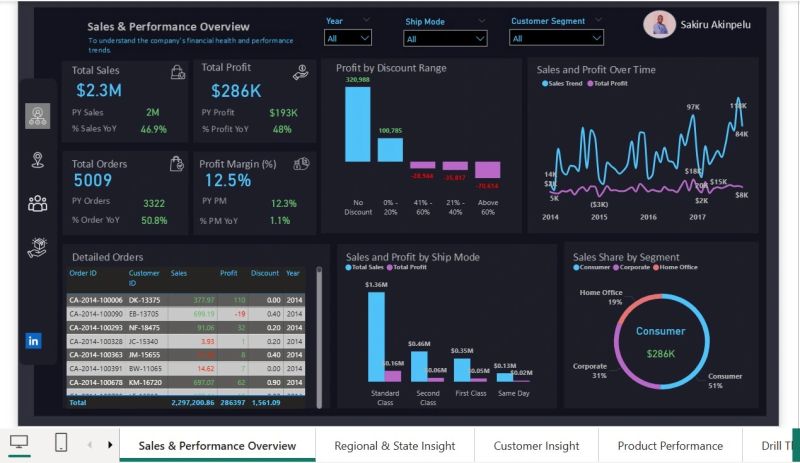
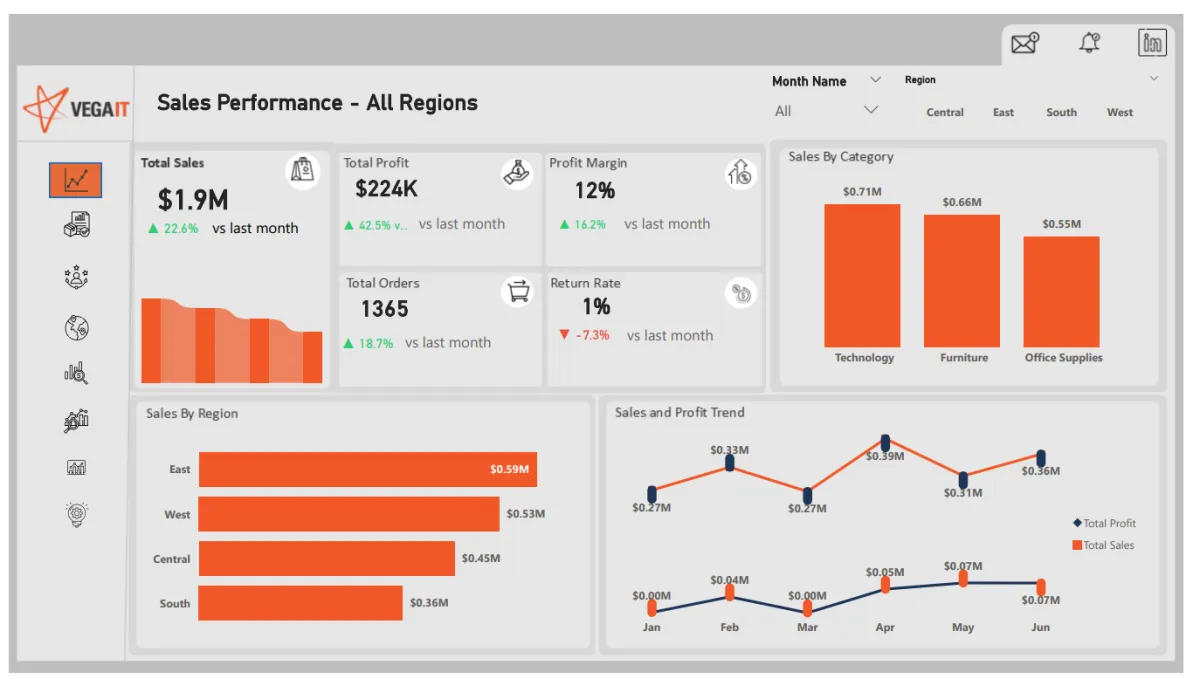
Sales Performance
Interactive sales performance dashboard with dynamic KPI cards and trend analysis.
E-Commerce Sales Performance
Multi-market e-commerce revenue analysis with regional breakdown and YoY growth tracking.
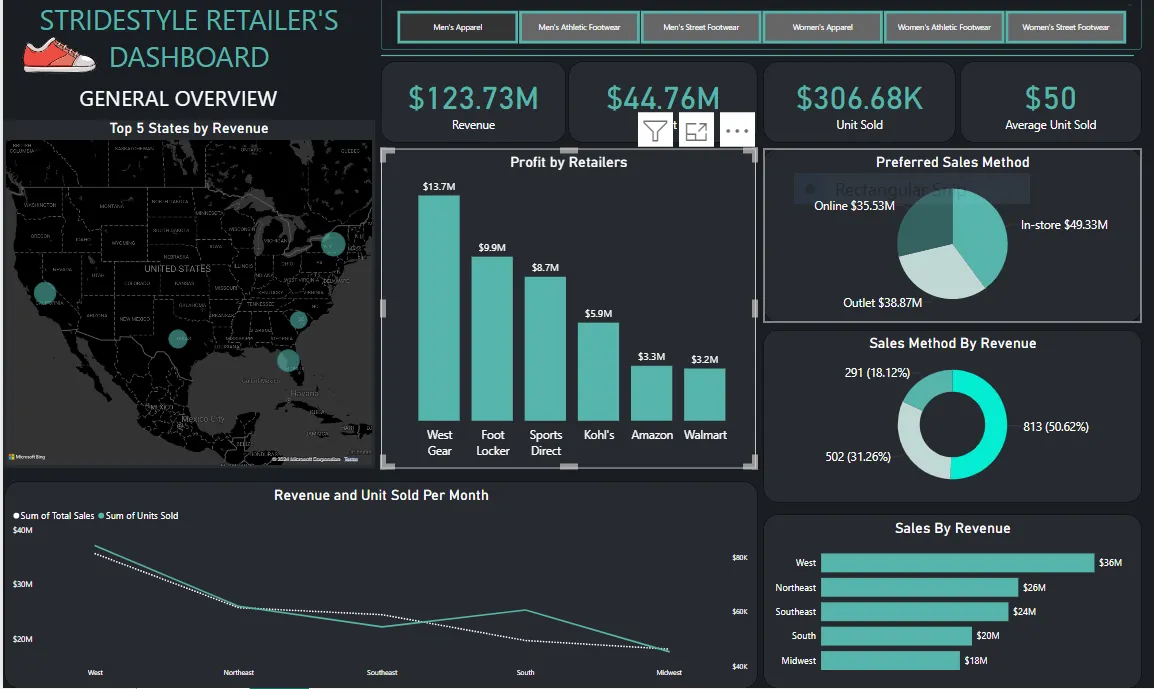
E-Commerce Retail Dashboard
Retail analytics dashboard built with Power BI and DAX for product and category performance monitoring.
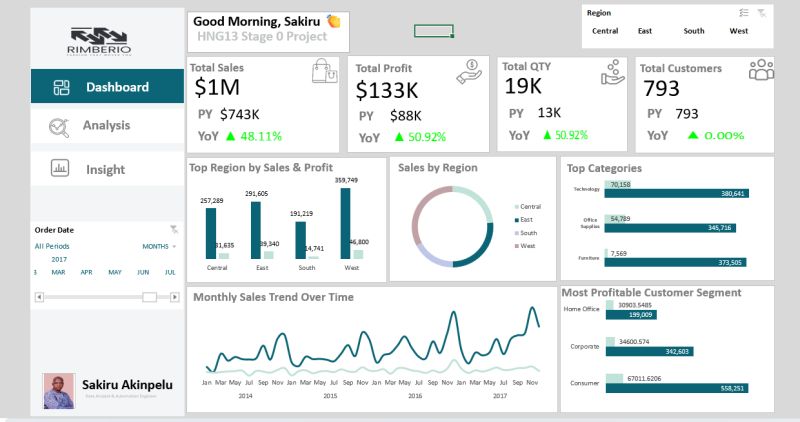
Sales Performance
Excel and Power Query dashboard tracking sales trends, product performance, and revenue targets.
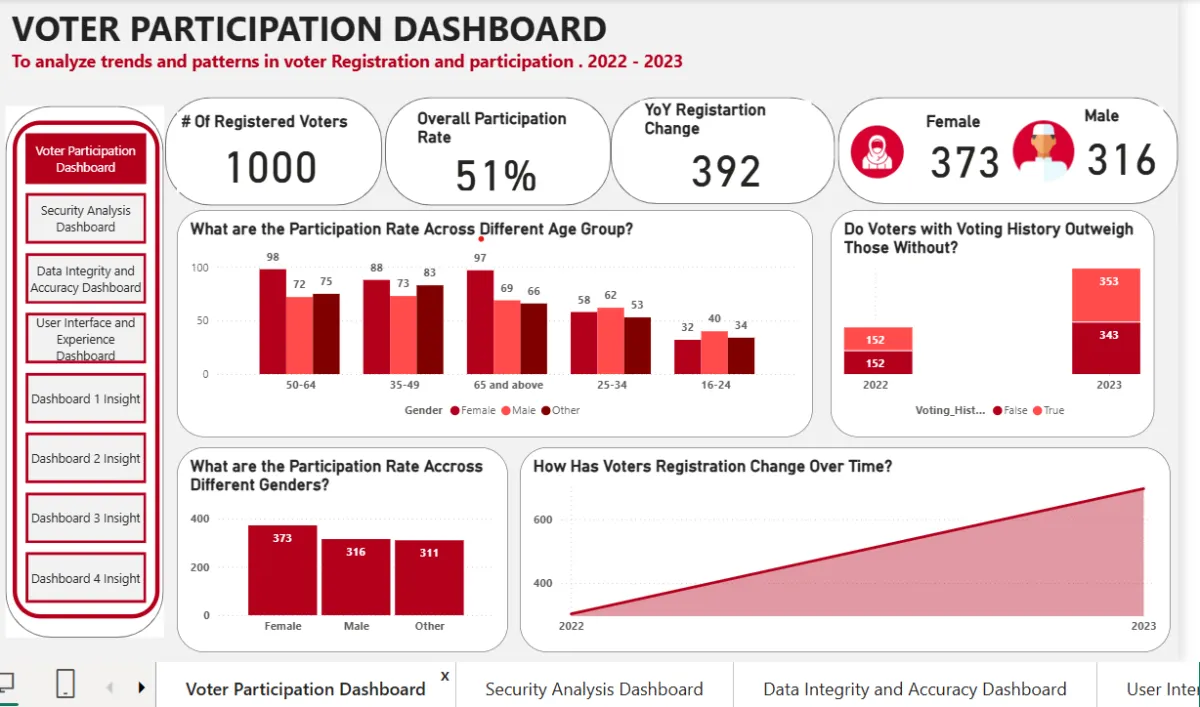
Voter Participation Dashboard
Civic analytics dashboard visualising voter turnout patterns and demographic participation data.
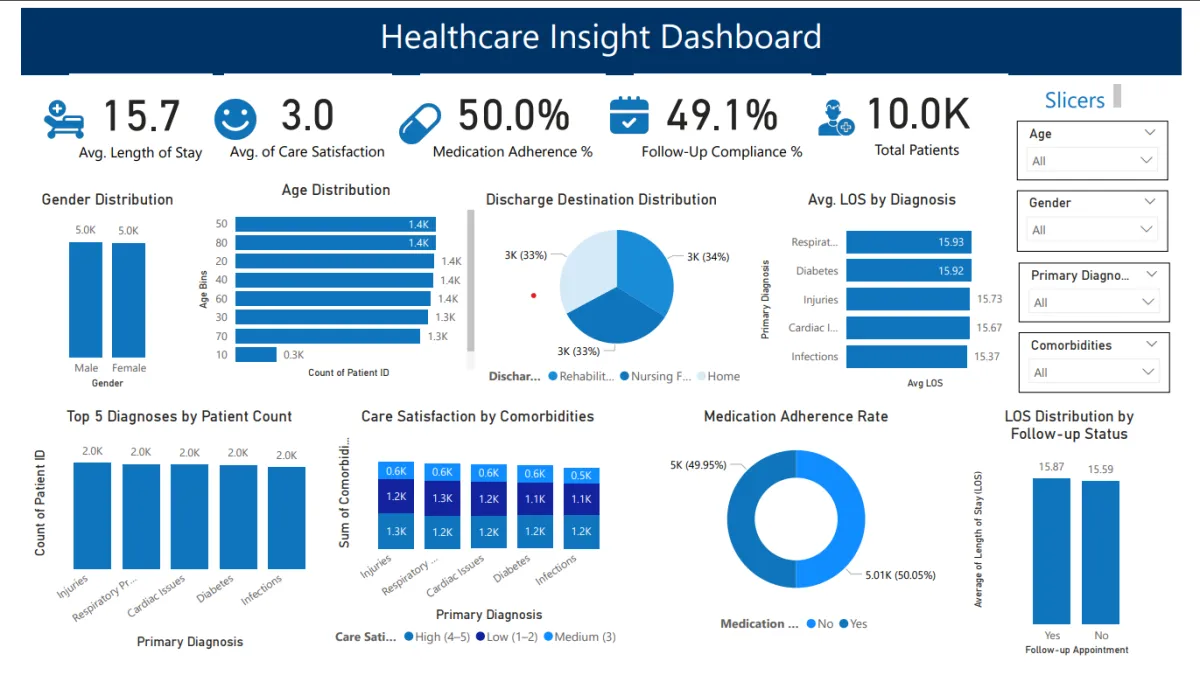
Healthcare Insight Dashboard
Healthcare data analysis dashboard tracking patient metrics, outcomes, and operational KPIs.
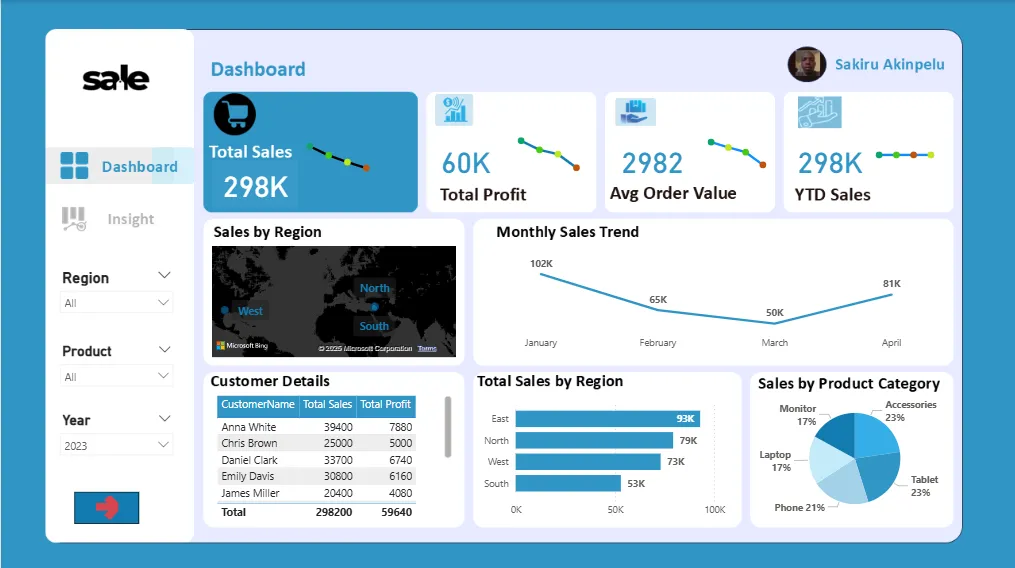
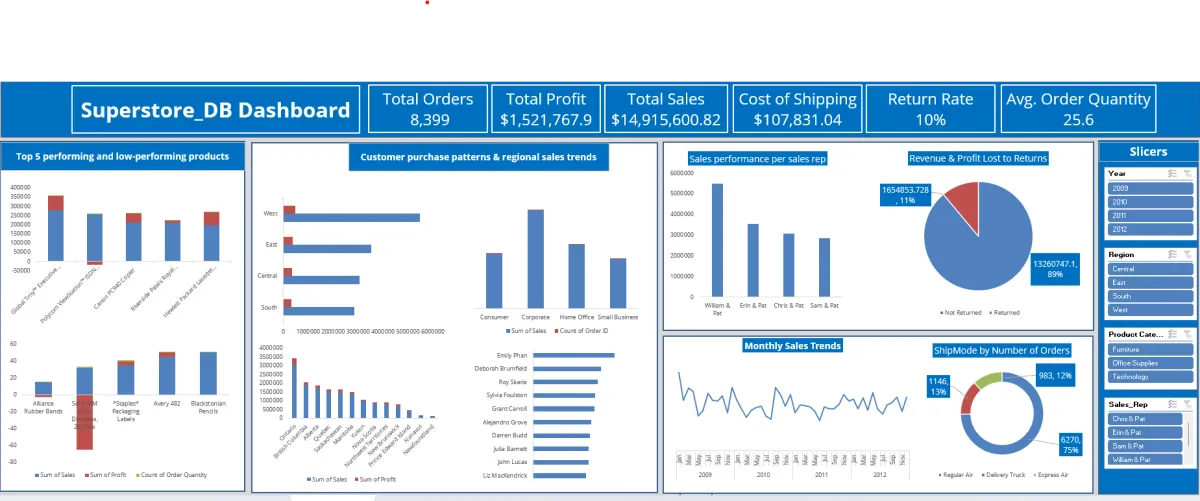
Sales Dashboard
Excel-based sales reporting dashboard with pivot-driven KPIs and monthly performance breakdowns.
Sales Dashboard
Power BI sales dashboard with interactive slicers, revenue breakdowns, and regional comparisons.
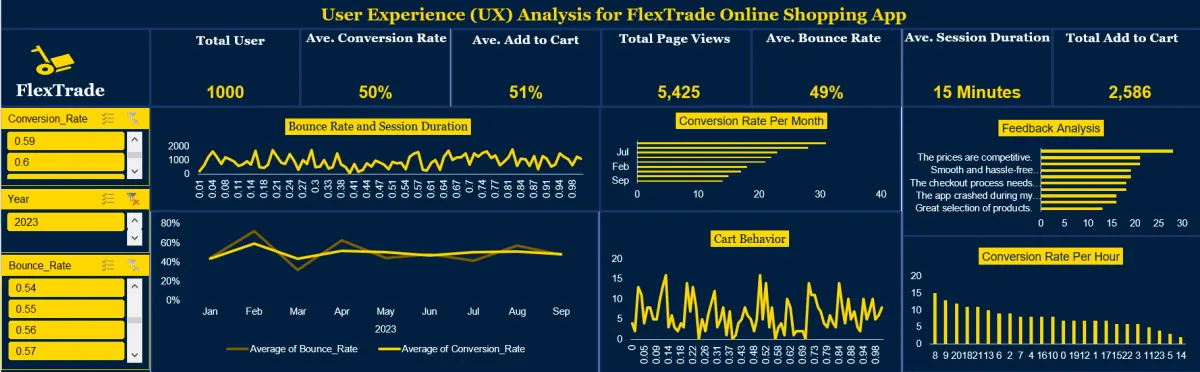
Website Analytics
Web traffic and user behaviour analytics dashboard tracking sessions, bounce rates, and conversions.
Sales Dashboard
Comprehensive sales performance tracker with category-level drill-down and target vs actual analysis.
Sales Dashboard
Multi-metric sales reporting solution with revenue trends, top products, and period comparisons.
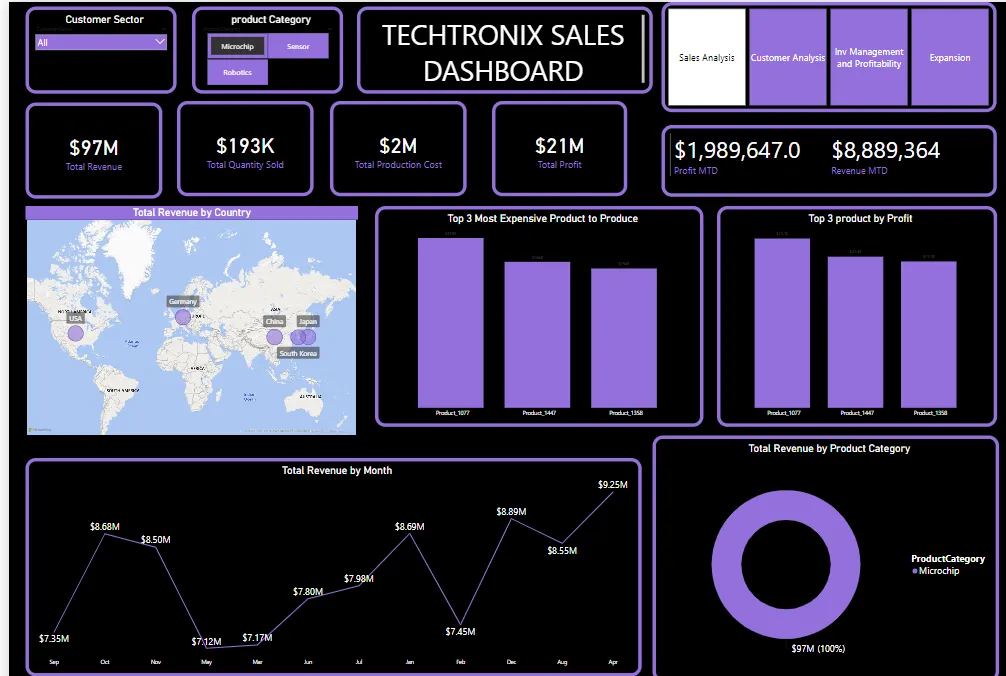
Sales Performance
Power BI dashboard delivering real-time sales performance visibility across regions and product lines.
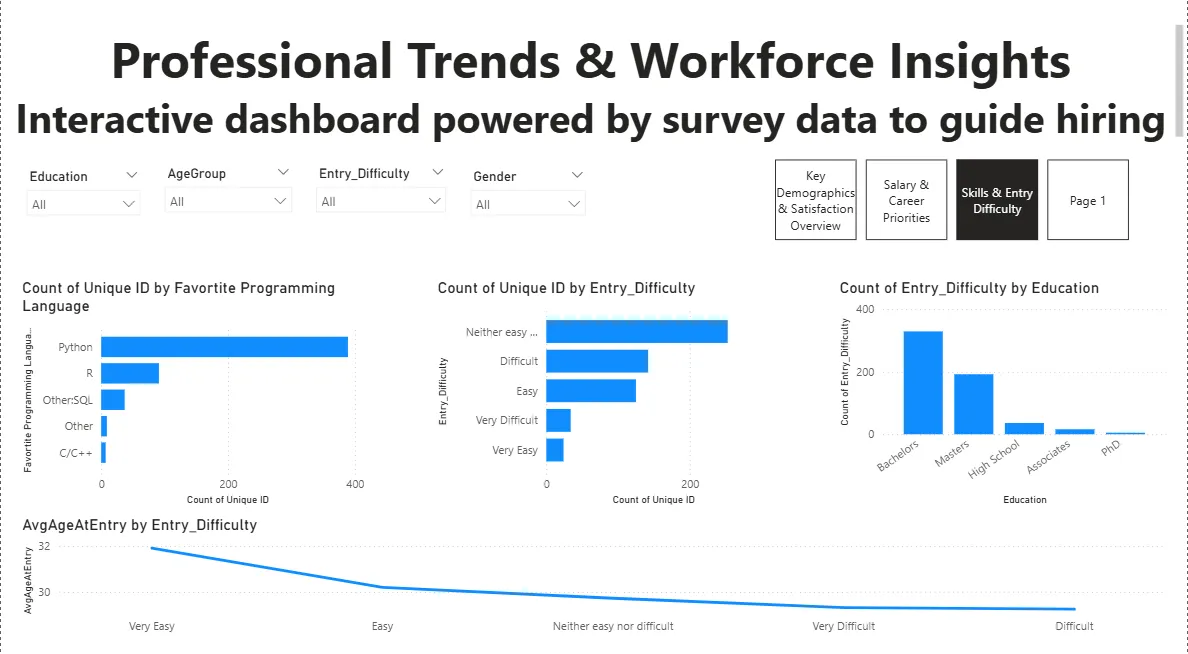
Workforce Insight
HR and workforce analytics dashboard tracking headcount, attrition, satisfaction, and organisational structure.
Sales Dashboard
Clean, executive-ready Excel sales dashboard with conditional formatting and automated KPI summaries.